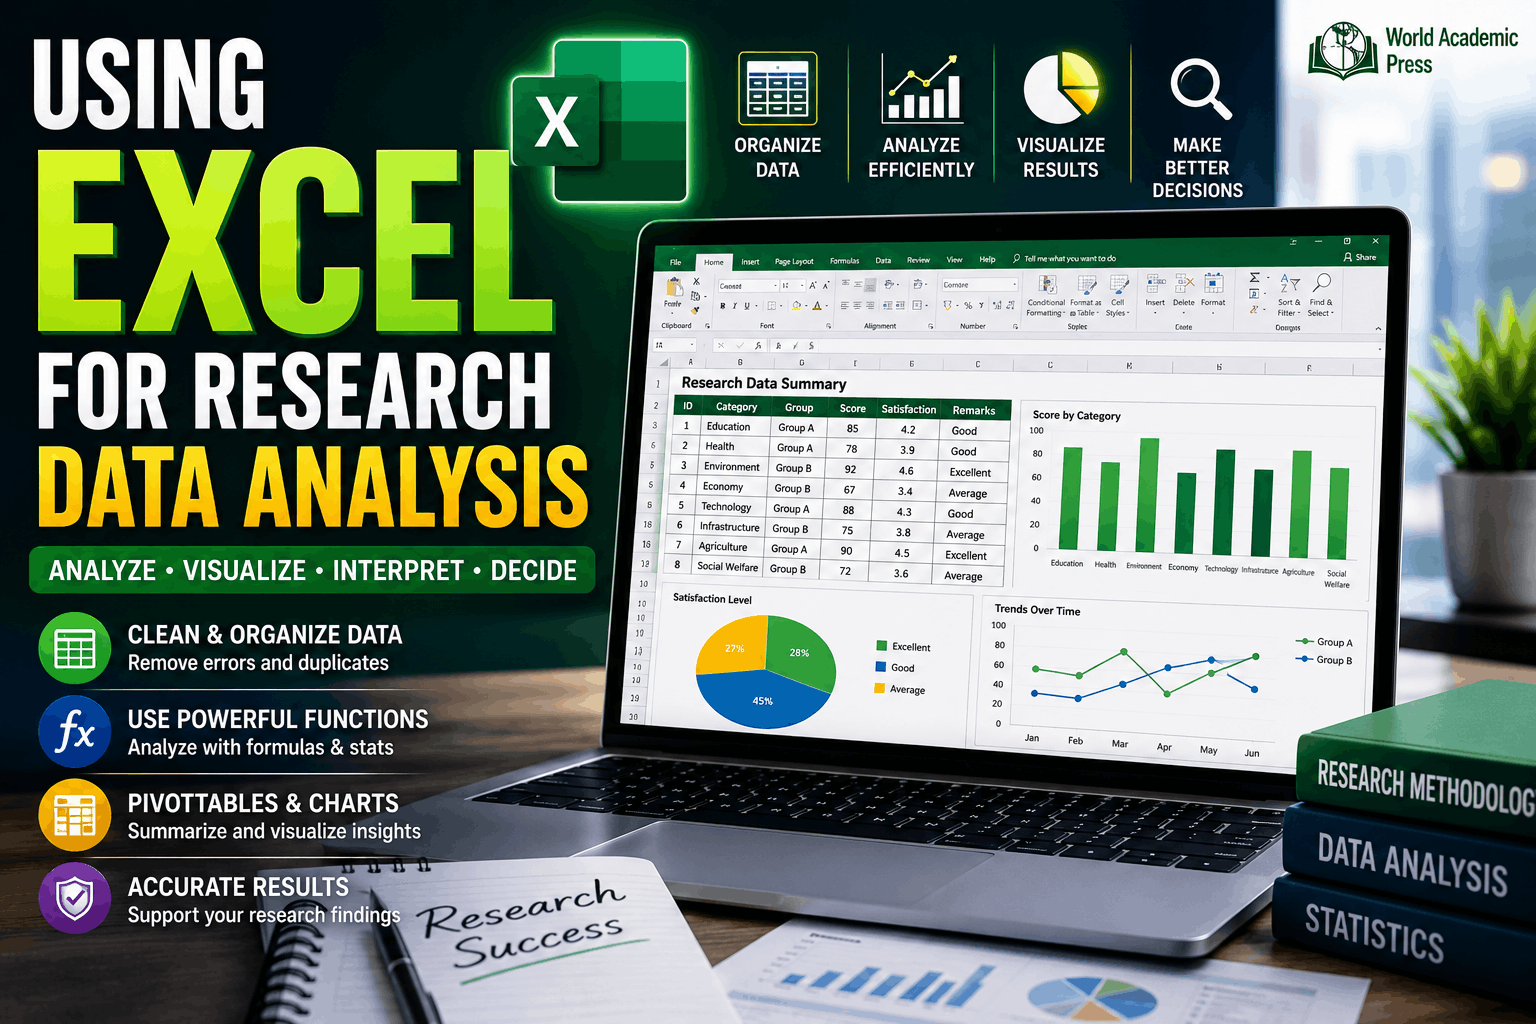
Using Excel for Research Data Analysis
Microsoft Excel is one of the most widely used tools for organizing, cleaning, analyzing, and visualizing research data. Its intuitive interface and built-in analytical features make it an excellent choice for students, researchers, and academics handling small to medium-sized datasets. While advanced statistical software is useful for complex analyses, Excel remains an essential tool for everyday research tasks.
Why Use Excel for Research?
- Easy to learn and widely available.
- Organizes large datasets efficiently.
- Performs basic statistical calculations.
- Creates charts and graphs quickly.
- Supports data cleaning and validation.
Key Excel Features for Researchers
- Sorting and filtering data
- Formulas and mathematical functions
- PivotTables for summarizing data
- Conditional formatting
- Charts and dashboards
- Data validation tools
- Descriptive statistics with the Analysis ToolPak
Steps to Analyze Research Data in Excel
- Import or enter research data.
- Clean the dataset by removing errors and duplicates.
- Organize variables using clear column headings.
- Apply formulas and statistical functions.
- Create PivotTables to summarize findings.
- Visualize results using charts and graphs.
- Interpret findings and prepare reports.
Useful Excel Functions
- AVERAGE()
- MEDIAN()
- COUNT()
- SUM()
- STDEV()
- IF()
- VLOOKUP() / XLOOKUP()
- COUNTIF()
Best Practices
- Maintain a clean dataset.
- Keep raw and analyzed data separate.
- Use descriptive variable names.
- Back up research files regularly.
- Verify formulas before reporting results.
- Document every analysis step.
Limitations of Excel
- Not ideal for very large datasets.
- Limited advanced statistical modeling.
- Requires careful formula verification.
- Less suitable for reproducible coding workflows than R or Python.
Related Research Methodology Articles
- Historical Research Methods
- Action Research in Education
- Case Study Research Explained
- Focus Group Discussions in Research
- How to Create Effective Survey Questions
- Interview Methods in Qualitative Research
- Questionnaire Design Tips for Researchers
- Probability vs Non-Probability Sampling
- Sampling Techniques in Research
- Meta-Analysis in Research: A Beginner's Guide
- How to Conduct a Systematic Literature Review
- Types of Research Designs Explained
- Research Proposal Mistakes to Avoid
- Validity and Reliability in Research
- How to Ensure Research Accuracy
- Statistical Tools Every Researcher Should Know
- Basics of SPSS for Academic Research
- Introduction to R Programming for Researchers
Improve Your Research Visibility
- Academic Research Visibility: Why It Matters for Researchers
- What Makes Research Discoverable Online?
- Strategies to Improve Academic Visibility in 2026
- How Researchers Can Increase Citation Counts in 2026
- How Academic Authors Can Build a Strong Research Profile
- Research Portfolio Development Tips (2026)
Conclusion
Microsoft Excel is a practical and accessible tool for research data analysis. Its features for organizing data, performing basic statistics, creating PivotTables, and generating visualizations make it an excellent starting point for academic research. Combined with sound research methodology, Excel helps researchers transform raw data into meaningful insights while preparing for more advanced statistical tools such as SPSS, R, and Python.